Friday, October 20, 2017
Revolution: A sudden, complete or marked change in something.
An apt descriptor to define what has transpired in the propane industry over the last five years is — Revolution. In that time span the United States became the global leader in propane exports, saw domestic demand shift to secondary status, and realized prolific growth in propane production. As with any revolution, two questions typically arise: will these changes continue and what will the impacts be? 
We have to look at several segments of the propane market in order to get complete answers.
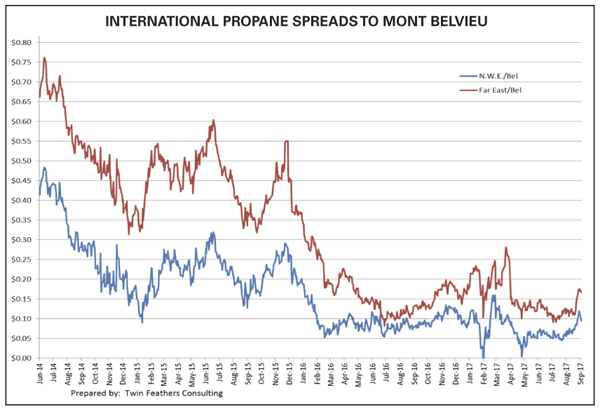
“Follow the money” may be the best path forward to understand if the propane export revolution will continue. The graph below highlights the narrow margin currently available on a monthly basis to move product from the U.S. to either the Far East or Northwest Europe (NWE).
To review, back in the margin heyday there was the capability to garner 60 cents/gal. to 70 cents/gal. moving product to the Far East and 40 cents/gal. to 45 cents/gal. shipping to NWE. As additional export capacity entered the market, the margin potentials hit a low of 8 cents/gal. to 10 cents/gal. to the Far East and zero to a half cent to NWE. In less than three years, the buildout of export terminals shrank margins by 80% to 90%.
However, smaller margins fail to explain why exports continue to exit the U.S., even as export facilities continued to be commissioned over the past five years. Keeping with “follow the money” logic, we notice significant investment has been made in propane export infrastructure over the last half decade.
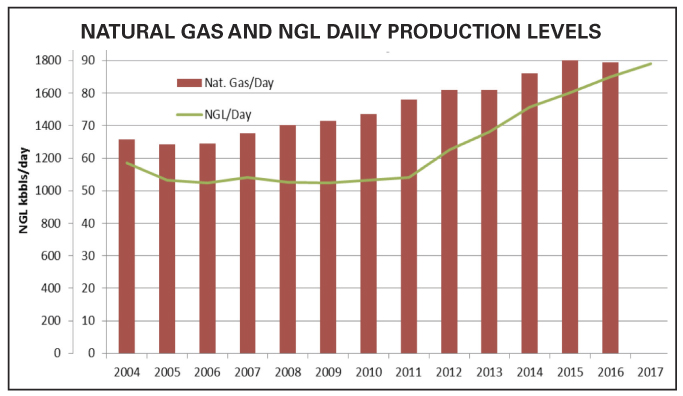
Behind this influx of investment dollars to export infrastructure stands either one of two things: strong expected world demand or strong anticipated domestic supply growth. As natural gas production started to rise, we see that NGL production was delayed, but started to ramp up heavily in the 2011 period and forward. The advent of higher wet gas plays — Marcellus and Utica shale as an example — have allowed natural gas producers the ability to scoop up additional benefits from drilling. With more NGL volumes, there arose the question of, What to do with them?
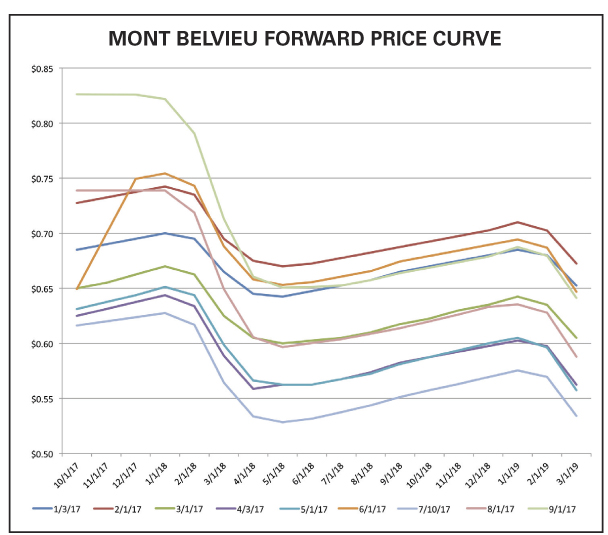
An enlightening view is to look at Mont Belvieu forward prices at the beginning of January for the last seven years. Over that period, there have been three instances when the December price came in below the January price. The widest positive price difference — December above January prices — occurred in January 2013 and was nearly 65 cents/gal. Taking a simple average of the price differences over seven years, we get a 12-month price curve that shows zero change between January and December.
Those in the heating-demand sector for propane might shrug and say, “Well, that could be normal because that compares the peak of two winter heating seasons.” However, when we compare the average summer prices to December values on the price curves over the last seven years we see these pieces of data:
1. Average price difference of 34 cents/gal. summer below December;
2. Widest differential is 47 cents/gal. summer below December;
3. Narrowest differential is 18 cents/gal. summer below December.
The very narrow January-to-December comparison (zero on average) and the narrow summer-to-December comparison make this point to the propane trading community: prices do not cover the cost of storage. Cost of storage has definitely increased over the years but has been above the average 34 cents/gal — the average price difference between summer/winter — for several years in the Belvieu market. Without futures prices covering storage costs, traders and marketers will look for other avenues to capture margins, i.e., the export arena. And the more exports increase, more backwardation has occurred in the propane pricing market.
Ultimately, this analysis tells us why the revolution started, but does not answer the question of whether or not the export revolution will continue. To answer that, we see three major factors that will need to take place. First, natural gas production needs to keep on rising. RBN Energy provided a detailed analysis on this point, and focused on just the Marcellus/Utica shale plays.
Jim Simpson, author of the article, states that the Northeast could see upward of 14.5 Bcfd of additional natural gas production by the end of 2019. Combining all regions of the U.S. based on producer expectations, there exists a potential for 24 Bcfd of output growth by the end of 2019. Not all of this growth will be in liquids-rich wet gas, but if that occurs, NGL production will be guaranteed to rise as well.
The second vital component for the export revolution to maintain course will be the availability of export capacity. While the last five years — 2013-2017 — have seen rapid growth in actual daily export volume, there has been even greater growth in overall export capacity. Based on Energy Information Administration data from 2016 and 2017, there appears to be a minimum of 200,000 bbld of additional export capacity that can be filled. If the utilization rate were to hit 90% for an entire year, then the U.S. could export 370 MMbbl of propane, or roughly 50 million more barrels than what the country is on pace to ship during 2017. Translating that potential for another 50 million barrels of total exports into production, we see that the U.S. propane output rate would need to increase by 137,000 bbld. Going back to 2011, when propane production started its upward trajectory, we see daily production rising nearly 600,000 bbld in that 2012 to 2017 period. Adding another 137,000 bbld appears attainable.
The final component necessary to keep the revolution churning involves forward prices. Since January 2017, the forward price curve comparing winter 2017-2018 to winter 2018-2019 has had one consistent trait, backwardation, meaning the front period is higher than the back period. That type of trend supports an earlier point that served as a launch pad for the revolution — no future price incentive to utilize storage.
Higher predicted propane production levels, excess export capacity, and future price curves that have remained backwardated will support the continuation of the export revolution over the next 18 to 24 months, at a minimum.
The impacts of this trend continuing will be multiple:

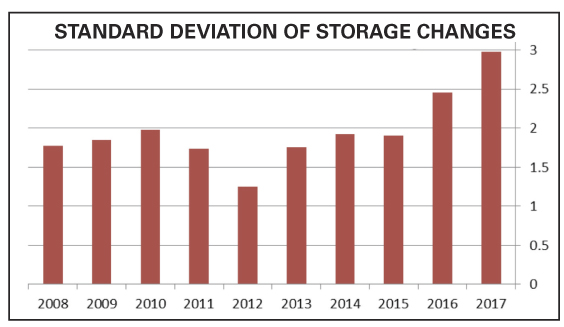
Two-thirds of the way through 2017, we see the highest standard deviation of storage changes in the last decade. The last two years in particular have seen strong increases in standard deviation as inventory levels surged over 100 MMbbl and then experienced rapid declines. But a large standard deviation does not only imply the ability for a quick decrease in inventory, but also a quick build up as well. The first five weeks of January saw a 28.3-MMbbl decline, and then a five week stretch in May/June that saw a build of nearly 15 MMbbl. Looking at this from another perspective, a mere 10% reduction in export capacity utilization could add 3.3 MMbbl of additional gas into storage during a given month. This rise in storage volatility and the dramatic two-way impact it could have on hub pricing was something our Twin Feathers team noted more than two years ago and was outlined at our presentation at the NPGA Southeast Convention this year.
An increase in storage volatility does not equate to a lack of overall supply for the market. The export revolution has started to bring faster fundamental responses based on international price levels. If storage levels dip to a perceived danger zone, prices can, in relative terms, quickly adjust and allow for more product to be made available to the U.S. consumer market . For example, cargo cancelations/deferments that occurred in the summer of 2016 and the first quarter of this year. Conversely, if storage levels surge, then prices will likely decrease to attract additional exports and run down domestic inventory.
Storage levels are still important for the U.S. consumer market, but they should not be viewed in a vacuum or be viewed as a standalone signal. As this export revolution keeps rolling, there are now multiple factors that are driving behavior. What does the U.S. consumer market need to do to manage this export revolution?
Written by JD Buss of Overland Park, Kan.-based Twin Feathers Consulting. Buss has worked with propane clients to devise and implement hedging strategies and optimize supply security plans since 2008. His prior experience includes employment at Koch Industries and Enron in risk management, as well as in marketing and trading roles. He holds a Financial Industry Regulatory Authority Series 3 license, and he is a CPA and a former small business owner.

We have to look at several segments of the propane market in order to get complete answers.
“Follow the money” may be the best path forward to understand if the propane export revolution will continue. The graph below highlights the narrow margin currently available on a monthly basis to move product from the U.S. to either the Far East or Northwest Europe (NWE).
To review, back in the margin heyday there was the capability to garner 60 cents/gal. to 70 cents/gal. moving product to the Far East and 40 cents/gal. to 45 cents/gal. shipping to NWE. As additional export capacity entered the market, the margin potentials hit a low of 8 cents/gal. to 10 cents/gal. to the Far East and zero to a half cent to NWE. In less than three years, the buildout of export terminals shrank margins by 80% to 90%.
However, smaller margins fail to explain why exports continue to exit the U.S., even as export facilities continued to be commissioned over the past five years. Keeping with “follow the money” logic, we notice significant investment has been made in propane export infrastructure over the last half decade.
Behind this influx of investment dollars to export infrastructure stands either one of two things: strong expected world demand or strong anticipated domestic supply growth. As natural gas production started to rise, we see that NGL production was delayed, but started to ramp up heavily in the 2011 period and forward. The advent of higher wet gas plays — Marcellus and Utica shale as an example — have allowed natural gas producers the ability to scoop up additional benefits from drilling. With more NGL volumes, there arose the question of, What to do with them?

An enlightening view is to look at Mont Belvieu forward prices at the beginning of January for the last seven years. Over that period, there have been three instances when the December price came in below the January price. The widest positive price difference — December above January prices — occurred in January 2013 and was nearly 65 cents/gal. Taking a simple average of the price differences over seven years, we get a 12-month price curve that shows zero change between January and December.
Those in the heating-demand sector for propane might shrug and say, “Well, that could be normal because that compares the peak of two winter heating seasons.” However, when we compare the average summer prices to December values on the price curves over the last seven years we see these pieces of data:
1. Average price difference of 34 cents/gal. summer below December;
2. Widest differential is 47 cents/gal. summer below December;
3. Narrowest differential is 18 cents/gal. summer below December.
The very narrow January-to-December comparison (zero on average) and the narrow summer-to-December comparison make this point to the propane trading community: prices do not cover the cost of storage. Cost of storage has definitely increased over the years but has been above the average 34 cents/gal — the average price difference between summer/winter — for several years in the Belvieu market. Without futures prices covering storage costs, traders and marketers will look for other avenues to capture margins, i.e., the export arena. And the more exports increase, more backwardation has occurred in the propane pricing market.
Ultimately, this analysis tells us why the revolution started, but does not answer the question of whether or not the export revolution will continue. To answer that, we see three major factors that will need to take place. First, natural gas production needs to keep on rising. RBN Energy provided a detailed analysis on this point, and focused on just the Marcellus/Utica shale plays.

Jim Simpson, author of the article, states that the Northeast could see upward of 14.5 Bcfd of additional natural gas production by the end of 2019. Combining all regions of the U.S. based on producer expectations, there exists a potential for 24 Bcfd of output growth by the end of 2019. Not all of this growth will be in liquids-rich wet gas, but if that occurs, NGL production will be guaranteed to rise as well.
The second vital component for the export revolution to maintain course will be the availability of export capacity. While the last five years — 2013-2017 — have seen rapid growth in actual daily export volume, there has been even greater growth in overall export capacity. Based on Energy Information Administration data from 2016 and 2017, there appears to be a minimum of 200,000 bbld of additional export capacity that can be filled. If the utilization rate were to hit 90% for an entire year, then the U.S. could export 370 MMbbl of propane, or roughly 50 million more barrels than what the country is on pace to ship during 2017. Translating that potential for another 50 million barrels of total exports into production, we see that the U.S. propane output rate would need to increase by 137,000 bbld. Going back to 2011, when propane production started its upward trajectory, we see daily production rising nearly 600,000 bbld in that 2012 to 2017 period. Adding another 137,000 bbld appears attainable.
The final component necessary to keep the revolution churning involves forward prices. Since January 2017, the forward price curve comparing winter 2017-2018 to winter 2018-2019 has had one consistent trait, backwardation, meaning the front period is higher than the back period. That type of trend supports an earlier point that served as a launch pad for the revolution — no future price incentive to utilize storage.
Higher predicted propane production levels, excess export capacity, and future price curves that have remained backwardated will support the continuation of the export revolution over the next 18 to 24 months, at a minimum.
The impacts of this trend continuing will be multiple:
- Storage at hub points will have little to no monetary value except for those with the ability to optimize volume into the export market.
- Domestic prices will continue to be heavily tied to international price movements. This means that weather in the U.S. could have some regional implications, but could have very limited impact on hub prices.
- Any sustained decrease in supply growth will only create more bullish pressure on prices, whereas any decrease in export capacity utilization will have a bearish pressure on prices.

Two-thirds of the way through 2017, we see the highest standard deviation of storage changes in the last decade. The last two years in particular have seen strong increases in standard deviation as inventory levels surged over 100 MMbbl and then experienced rapid declines. But a large standard deviation does not only imply the ability for a quick decrease in inventory, but also a quick build up as well. The first five weeks of January saw a 28.3-MMbbl decline, and then a five week stretch in May/June that saw a build of nearly 15 MMbbl. Looking at this from another perspective, a mere 10% reduction in export capacity utilization could add 3.3 MMbbl of additional gas into storage during a given month. This rise in storage volatility and the dramatic two-way impact it could have on hub pricing was something our Twin Feathers team noted more than two years ago and was outlined at our presentation at the NPGA Southeast Convention this year.
An increase in storage volatility does not equate to a lack of overall supply for the market. The export revolution has started to bring faster fundamental responses based on international price levels. If storage levels dip to a perceived danger zone, prices can, in relative terms, quickly adjust and allow for more product to be made available to the U.S. consumer market . For example, cargo cancelations/deferments that occurred in the summer of 2016 and the first quarter of this year. Conversely, if storage levels surge, then prices will likely decrease to attract additional exports and run down domestic inventory.
Storage levels are still important for the U.S. consumer market, but they should not be viewed in a vacuum or be viewed as a standalone signal. As this export revolution keeps rolling, there are now multiple factors that are driving behavior. What does the U.S. consumer market need to do to manage this export revolution?
- Monitor international price spreads
- Track production level changes
- Watch for when export capacity rises or falls
- Observe any changes in the structure of the forward price curve
- Identify how these variables can then impact regional supply availability and pricing
Written by JD Buss of Overland Park, Kan.-based Twin Feathers Consulting. Buss has worked with propane clients to devise and implement hedging strategies and optimize supply security plans since 2008. His prior experience includes employment at Koch Industries and Enron in risk management, as well as in marketing and trading roles. He holds a Financial Industry Regulatory Authority Series 3 license, and he is a CPA and a former small business owner.


