

Wednesday, April 25, 2018
By JD Buss… "Widespread daily record low temperatures and record cold high temperatures were set from Dec. 27, 2017 to Jan. 7, 2018,” per the Weather Channel. Some specific stats from this past winter: 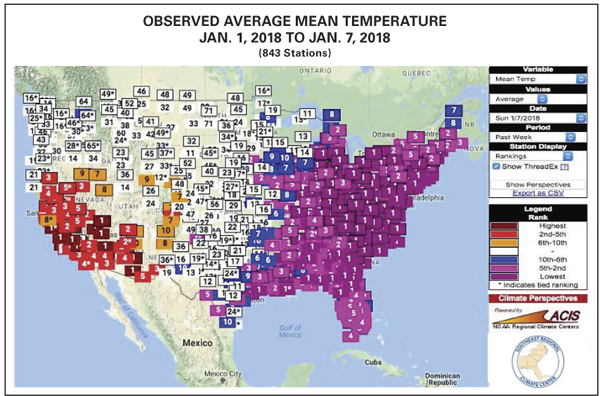
1. New York City set a record low for the first seven days of January, averaging 16.4ºF.
2. Pittsburgh broke the 1879 record of the coldest first week of January.
3. Raleigh and Charlotte, N.C. saw their coldest first week of the year, breaking the 1887 record.
4. New Orleans tied its coldest first week of the year.
The map from the Southeast Regional Climate Center highlights the extreme cold temperatures for a strong portion of the Eastern U.S. in the first week of January.
To propane retailers, this weather pattern might have signaled the official start to a phenomenal winter heating demand season, but in regard to price direction, this winter kicked off months prior. This reveals that the times are a-changin’ in the propane industry.
In the eyes of the propane market, winter 2017-2018 kicked off on June 26, 2017. On that day, front-month Mont Belvieu prices hit a low of 57 cents/gal. and began a steady climb through most of 2017. At the same time, every future-oriented price spread became highly bullish. A sample of these spreads can be seen in Fig. 1 for this time period.
As a result, strong and consistent bull spread positions (owning the current period and selling or “shorting” a future period) were seen in much of the trading community for the second half of 2017. At the heart of this position was a view that strong future exports, coupled with domestic demand, would generate a potential shortage of supply, thus driving up prices in the current periods.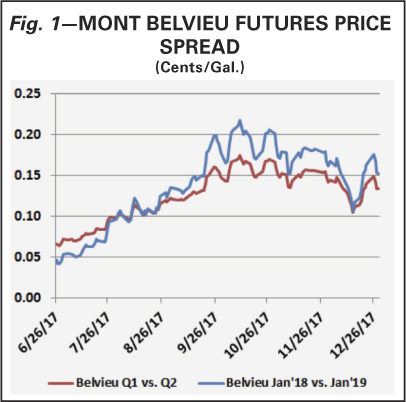
Right at the time when domestic consumption was starting to rise due to the extreme cold temperatures shown on the map, the bull spreads began to diminish in December and January. Fig. 2 shows the change in the price spreads between February to March and March to April as a result of the reduction of bull spreads in the market during this period.
The graph shows that spreads hit a peak in December, then dipped during the latter half of December, only to rise again at the start of January. When retail propane demand was at its peak this winter, we saw these spreads fall back to lower levels throughout January. Why is this important? Such a strong backwardated market (current period contract above a future period contract) reflects a bullish environment. This year, however, that bullish environment was based on anticipated exports and domestic demand remaining strong as the winter months continued. But neither of these became a reality in the first quarter of 2018.
Looking at the export portion of that equation, market participants were watching future price spreads (using March to April as an example) to see if it was profitable to keep exporting at high levels. Backwardated price spreads can create a situation where a vessel loaded in the current month could arrive in a future month at a time when prices are lower—creating a disincentive to export propane from a higher-priced month to a lower-priced future period.
Winter 2017-2018 will likely go down as one of the most steady regarding export volumes since the 2013-2014 winter. In recent years, exports have seen volatile monthly shifts based on volume. Table 1 on p. 66 is a high and low breakdown of volumes for winter exports.
With lower volatility on volume month to month and lower overall export volumes compared to winter 2016-2017, export demand did not support higher Mont Belvieu prices for the balance of the winter. This means domestic consumption needs to be the support for bullish values.
Earlier we highlighted the massive cold spell that covered huge areas of the Midwest and eastern U.S. at the end of December 2017 and start of January 2018. A chain of events in the New England region — starting with a delayed import vessel and then a short-line railroad bridge collapse two weeks later — resulted in a strong pull for domestic product in the Northeast that quickly moved to other regions.
The regional supply tightness generated the highest basis levels seen since the polar vortex (values reaching anywhere to +50 cents/gal. to even +100 cents/gal. above Mont Belvieu) and had many retailers searching for spot volumes. What was more important was the fact that weather began to subside and warm near the end of January and did not bring a similar cold snap for the eastern U.S. during February. This left many in the East in a similar situation as prior winters: long propane.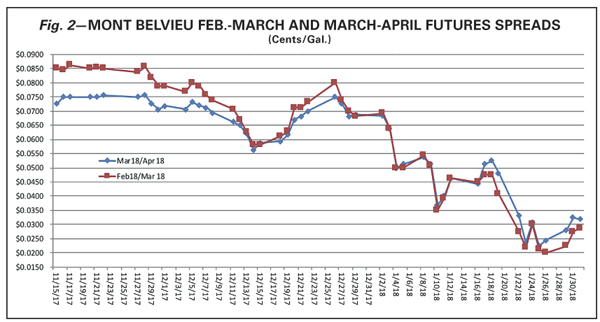
And what was Belvieu doing in January while domestic demand was booming? It fell over 15 cents/gal. by the end of January. As this article is being written in the first few days of March, Mont Belvieu was down 23 to 25 cents/gal. from the peaks in December. All of this leads to one major conclusion: international markets continue to be the major driving force behind propane hub prices in the U.S.
The winter 2017-2018 market rally really began in June 2017 when international trading firms placed their bets on the possible inventory situation that could arise during the upcoming winter. Those who placed their bets early were able to cash out in December and January when the evidence pointed to exports failing to drain the U.S. inventory levels with their steady, but below expected, monthly rates.
Further support for our conclusion can also be seen by the fact that one of the coldest periods to affect U.S. population areas drove only the basis markets, and the major hub values actually experienced a strong decline.
What does this mean for retailers in the future? As we’ve stated in several presentations, the retail sector is now in the minority of overall propane demand. Not only is the sector now in the minority, the typical retailer demand profile relies heavily on storage, something that is not currently as vital for the export markets. By comparison, for retailers to clear a single VLGC (very large gas carrier) export vessel’s volume, they need to move anywhere from 2400 to 2500 trucks or 770 railcars. That’s more volume on one ship than the average independent retailer in the U.S. moves annually.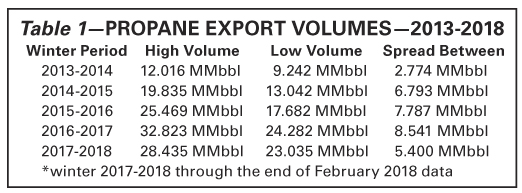
Managing these items for the future will require that retailers become much more attuned to international economics and how they impact pricing, all the way back to their region. It will also entail retailers looking for more supply flexibility and optionality in order to handle their peak demand periods. While storage may not be vital within the export markets, it remains essential on the local level and retailers need to make serious assessments of their overall storage needs versus actual capacity.
Recently the NPGA Benchmarking groups, along with Twin Feathers, have been conducting surveys and providing analysis to help firms identify any shortcomings in their storage infrastructure. In addition, Twin Feathers has been working for over a year to develop supply products that allow for the needed flexibility and optionality mentioned above.
Winter 2017-2018 really kicked off in June last year. There’s no telling when the kickoff for winter 2018-2019 will begin. Whenever it starts, retailers should be actively taking steps now to plan for winter. Yes, the times, they are a-changin’. Don’t let the changes manage you, but rather take action now to help your business adapt and benefit from the changes that are taking place.
JD Buss of Overland Park, Kan.-based Twin Feathers Consulting has worked with propane clients to devise and implement hedging strategies and optimize supply security plans since 2008. His prior experience includes employment at Koch Industries and Enron in risk management, as well as in marketing and trading roles. He holds a Financial Industry Regulatory Authority Series 3 license, and he is a CPA and a former small business owner.