
Tuesday, October 15, 2019
(October 15, 2019) — Look at the numbers that matter and only the numbers that matter. This is an excellent practice that will help managers make critical operating decisions. Mike Shilts says that with the right tools and habits, managers can have the numbers they need and not be distracted by those they don’t.
Shilts is vice president of marketing and business development at K & K Management Solutions (Indianapolis), a company that provides software to manage propane and refined fuel delivery.

He has degrees in psychology and finance/accounting (CPA) and a background that includes 15 years as director of retail operations at a family-owned propane business that had seven branches.
In his seminar at the NPGA Southeastern Convention, “Drowning in Data? How to Make Critical Decisions With Key Metrics and Cut Paperwork 90%,” Shilts shared with the audience the types of data he used to manage those branches. He walked attendees through 10 Excel worksheets and explained the key metrics they display. By focusing on these metrics, he added, marketers can improve their businesses while also cutting out unnecessary paperwork.
Each of his worksheets is designed so that a customer service representative can fill it out in less than five minutes. When a worksheet is complete, he said, it creates a visual display that quickly portrays your most important and timely information.
“You can’t improve and modernize your business if you have to spend all your time digging up these numbers,” Shilts said. “You should have these numbers right at your fingertips.”
Among the numbers that are to be recorded on the worksheets, and the reasons they are there, are the following:
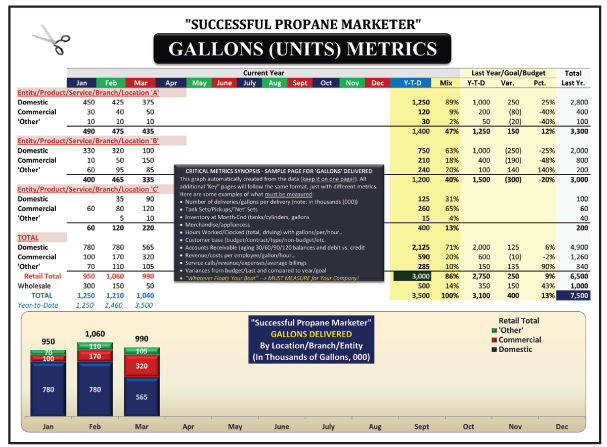
Gallons (Units) Metrics: Gallons delivered each month and year to date are recorded on this worksheet. The totals are broken down by location, branch, or entity and by type of customer (domestic, commercial, etc.). Each of these is compared to last year, the goal, or the budget. “This is the most important metric; no money is made unless gas is delivered to a customer’s tank,” Shilts said.
Tank Sets, Pickups, Net Sets Metrics: This worksheet records the number of sets and pickups and the net sets—the difference between the two—for each month and year to date. The totals are broken down by location, branch, or entity. Each of these is compared to last year. “You don’t want pickups unless you’re not running fuel through those tanks because of the very high cost of steel.” A seminar attendee asked if he has kept metrics on the reasons for pickup. Shilts answered, “Not here, but I did track controllable and uncontrollable reasons for pickups. You want to know the total number first, then you can investigate why. You start with the big level, then ‘drill down’ to the next level.”
Goal Metrics (Gallons/Tank Sets): This worksheet tracks progress toward goals in the number of gallons delivered and tank sets/customers. For each, it records the location’s goal, total to date, percent of goal, and number of units above or below the goal. “These are the numbers you should show employees—the top-level goals and where they stand toward those goals, which are great company-wide motivators,” Shilts said.
Margin Metrics (Aggregate/By Product): The number of gallons delivered and the aggregate margin dollars are recorded on this worksheet. These are broken down by customer type (domestic, commercial, industrial, and wholesale) and by location. During the seminar, Shilts showed a sample worksheet with the numbers for three marketers: one high-margin, one equal products, and one low-margin. “They all sold the same number of gallons, but they have wildly different margins,” he noted. “That is what buyers look at, so you should look at what is generating the highest margins and cash flow.”
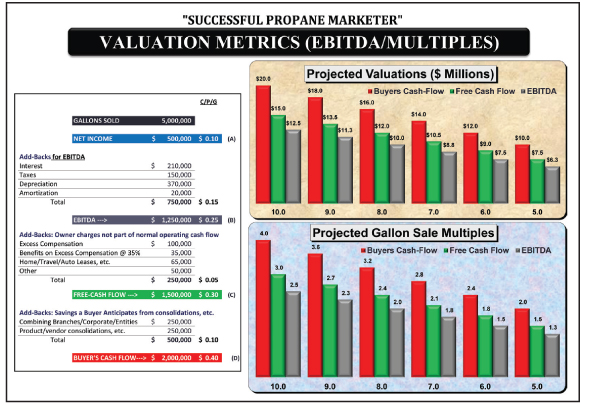
Valuation Metrics (EBITDA/Multiples): This worksheet calculates earnings before interest, taxes, depreciation, and amortization (EBITDA); free cash flow; and buyer’s cash flow. It also shows projected valuations and projected gallon sales multiples. “You want to be sure that you are selling a ‘castle’ and not a ‘shack’ to a prospective buyer,” Shilts said. “They are not interested in the number of gallons, but the aggregate margin on those gallons.”
Delivery Metrics (Increased Drop Size Savings): On this worksheet, users insert their data or projections for annual gallons delivered, projected increase in gallons per drop, initial average gallons per drop, and cost per drop. The worksheet then calculates the decrease in the number of drops by increasing drop size and the annual savings by increasing drop size. “The fewer times you handle the product, the fewer stops you make, the more money you make since this is primarily a distribution business,” Shilts noted. “This worksheet shows the effect of five-gallon improvements per drop. You can set these as a goal, plus it helps explain why you need to closely monitor will-call deliveries.”
Delivery Metrics (Reduced Excess Drops Savings): Here, users insert their data or projections for total drops, initial “excess drops” percentage, projected decrease percentage in “excess drops,” and cost per drop. The worksheet then calculates the decrease in the number of excess drops and the savings by decreasing excess drops. “This number should be zero—it’s excess, so reducing excess is a step in the right direction,” Shilts said. “Yes, we want to take care of the customer, but we don’t want to deliver when they are at 60%. Bobtails and driver costs are way too expensive to make excess drops.”
Cash Flow Metrics (12-Month Rolling): This worksheet records beginning cash balance; inflow and outflow in cash from operations, cash from investments, and cash from financing; net cash in or out; and end cash balance. It records this for each month and for the year. “Cash flow is what counts; you have to generate cash flow,” Shilts said. “It is 12-month rolling, so you can see what to expect on a continuing basis and continuously make adjustments.”
Break-even Metrics (Revenue and Units): Revenue, variable costs, fixed costs, net income (profit), and contribution margin are recorded on this worksheet. “This worksheet answers the question, ‘What’s my nut of fixed costs I have to overcome before I make a profit?’ It helps you see what margin you need to break even.”
Financing Metrics (Banker’s Ratios and Tools): This worksheet records net income; earnings before interest and taxes (EBIT); earnings before interest, taxes, depreciation, and amortization (EBITDA); adjusted EBITDA; and total cash flow after debt service. It also calculates ratios between these figures. “These are what a banker looks at,” Shilts explained. “They are about mitigating risk.”
Throughout the seminar, Shilts offered some additional tips for recording key metrics and cutting paperwork.
First, he advised attendees to stamp out “Excel-itis.” “That is the biggest time-waster,” he said. To limit the time spent keying in data, take information electronically from propane software. Then, focus on the big picture. Having too much data is as bad as having too little data.
Second, Shilts advised propane marketers to never make operating decisions from the financial statements. “You want to measure everything in cents per gallon on a timely basis,” he said. “You won’t get that from a financial statement.”
Third, Shilts suggested that attendees focus on the big picture by looking at only three digits (representing thousands) on worksheets. For example, “444=444 thousand,” not “444,444.” He explained, “You don’t need that level of detail to make ‘30,000-foot’ decisions. You want to get the big picture, not see all the detailed numbers at once.”
In addition to his role at K & K Management Solutions, Mike Shilts is a consultant and public speaker. He offers seven presentations as well as custom presentations that share best practices for a variety of industry audiences. To get an Excel file that contains all these worksheets, plus a brochure about the presentations, send an email to This email address is being protected from spambots. You need JavaScript enabled to view it. with BPNews in the subject line. For more information, contact him at (517) 815-4052 or This email address is being protected from spambots. You need JavaScript enabled to view it.. — Steve Relyea
Shilts is vice president of marketing and business development at K & K Management Solutions (Indianapolis), a company that provides software to manage propane and refined fuel delivery.
He has degrees in psychology and finance/accounting (CPA) and a background that includes 15 years as director of retail operations at a family-owned propane business that had seven branches.
In his seminar at the NPGA Southeastern Convention, “Drowning in Data? How to Make Critical Decisions With Key Metrics and Cut Paperwork 90%,” Shilts shared with the audience the types of data he used to manage those branches. He walked attendees through 10 Excel worksheets and explained the key metrics they display. By focusing on these metrics, he added, marketers can improve their businesses while also cutting out unnecessary paperwork.
Each of his worksheets is designed so that a customer service representative can fill it out in less than five minutes. When a worksheet is complete, he said, it creates a visual display that quickly portrays your most important and timely information.
“You can’t improve and modernize your business if you have to spend all your time digging up these numbers,” Shilts said. “You should have these numbers right at your fingertips.”
Among the numbers that are to be recorded on the worksheets, and the reasons they are there, are the following:
Gallons (Units) Metrics: Gallons delivered each month and year to date are recorded on this worksheet. The totals are broken down by location, branch, or entity and by type of customer (domestic, commercial, etc.). Each of these is compared to last year, the goal, or the budget. “This is the most important metric; no money is made unless gas is delivered to a customer’s tank,” Shilts said.
Tank Sets, Pickups, Net Sets Metrics: This worksheet records the number of sets and pickups and the net sets—the difference between the two—for each month and year to date. The totals are broken down by location, branch, or entity. Each of these is compared to last year. “You don’t want pickups unless you’re not running fuel through those tanks because of the very high cost of steel.” A seminar attendee asked if he has kept metrics on the reasons for pickup. Shilts answered, “Not here, but I did track controllable and uncontrollable reasons for pickups. You want to know the total number first, then you can investigate why. You start with the big level, then ‘drill down’ to the next level.”
Goal Metrics (Gallons/Tank Sets): This worksheet tracks progress toward goals in the number of gallons delivered and tank sets/customers. For each, it records the location’s goal, total to date, percent of goal, and number of units above or below the goal. “These are the numbers you should show employees—the top-level goals and where they stand toward those goals, which are great company-wide motivators,” Shilts said.
Margin Metrics (Aggregate/By Product): The number of gallons delivered and the aggregate margin dollars are recorded on this worksheet. These are broken down by customer type (domestic, commercial, industrial, and wholesale) and by location. During the seminar, Shilts showed a sample worksheet with the numbers for three marketers: one high-margin, one equal products, and one low-margin. “They all sold the same number of gallons, but they have wildly different margins,” he noted. “That is what buyers look at, so you should look at what is generating the highest margins and cash flow.”
Valuation Metrics (EBITDA/Multiples): This worksheet calculates earnings before interest, taxes, depreciation, and amortization (EBITDA); free cash flow; and buyer’s cash flow. It also shows projected valuations and projected gallon sales multiples. “You want to be sure that you are selling a ‘castle’ and not a ‘shack’ to a prospective buyer,” Shilts said. “They are not interested in the number of gallons, but the aggregate margin on those gallons.”
Delivery Metrics (Increased Drop Size Savings): On this worksheet, users insert their data or projections for annual gallons delivered, projected increase in gallons per drop, initial average gallons per drop, and cost per drop. The worksheet then calculates the decrease in the number of drops by increasing drop size and the annual savings by increasing drop size. “The fewer times you handle the product, the fewer stops you make, the more money you make since this is primarily a distribution business,” Shilts noted. “This worksheet shows the effect of five-gallon improvements per drop. You can set these as a goal, plus it helps explain why you need to closely monitor will-call deliveries.”
Delivery Metrics (Reduced Excess Drops Savings): Here, users insert their data or projections for total drops, initial “excess drops” percentage, projected decrease percentage in “excess drops,” and cost per drop. The worksheet then calculates the decrease in the number of excess drops and the savings by decreasing excess drops. “This number should be zero—it’s excess, so reducing excess is a step in the right direction,” Shilts said. “Yes, we want to take care of the customer, but we don’t want to deliver when they are at 60%. Bobtails and driver costs are way too expensive to make excess drops.”
Cash Flow Metrics (12-Month Rolling): This worksheet records beginning cash balance; inflow and outflow in cash from operations, cash from investments, and cash from financing; net cash in or out; and end cash balance. It records this for each month and for the year. “Cash flow is what counts; you have to generate cash flow,” Shilts said. “It is 12-month rolling, so you can see what to expect on a continuing basis and continuously make adjustments.”
Break-even Metrics (Revenue and Units): Revenue, variable costs, fixed costs, net income (profit), and contribution margin are recorded on this worksheet. “This worksheet answers the question, ‘What’s my nut of fixed costs I have to overcome before I make a profit?’ It helps you see what margin you need to break even.”
Financing Metrics (Banker’s Ratios and Tools): This worksheet records net income; earnings before interest and taxes (EBIT); earnings before interest, taxes, depreciation, and amortization (EBITDA); adjusted EBITDA; and total cash flow after debt service. It also calculates ratios between these figures. “These are what a banker looks at,” Shilts explained. “They are about mitigating risk.”
Throughout the seminar, Shilts offered some additional tips for recording key metrics and cutting paperwork.
First, he advised attendees to stamp out “Excel-itis.” “That is the biggest time-waster,” he said. To limit the time spent keying in data, take information electronically from propane software. Then, focus on the big picture. Having too much data is as bad as having too little data.
Second, Shilts advised propane marketers to never make operating decisions from the financial statements. “You want to measure everything in cents per gallon on a timely basis,” he said. “You won’t get that from a financial statement.”
Third, Shilts suggested that attendees focus on the big picture by looking at only three digits (representing thousands) on worksheets. For example, “444=444 thousand,” not “444,444.” He explained, “You don’t need that level of detail to make ‘30,000-foot’ decisions. You want to get the big picture, not see all the detailed numbers at once.”
In addition to his role at K & K Management Solutions, Mike Shilts is a consultant and public speaker. He offers seven presentations as well as custom presentations that share best practices for a variety of industry audiences. To get an Excel file that contains all these worksheets, plus a brochure about the presentations, send an email to This email address is being protected from spambots. You need JavaScript enabled to view it. with BPNews in the subject line. For more information, contact him at (517) 815-4052 or This email address is being protected from spambots. You need JavaScript enabled to view it.. — Steve Relyea