Monday, March 16, 2020
(March 16, 2020) — U.S. retail sales of odorized propane topped off at 9.3 billion gallons in 2018, marking a 13.6% advance over the 8.2 billion gallons sold in 2017, reports ICF International’s Annual Retail Propane Sales Report: U.S. Odorized Propane Sales by State and End-Use Sector. As noted by the Propane Education & Research Council (PERC), which commissions the annual survey, the stronger tally marked the first time since 2014 that sales exceeded 9 billion gallons. Further, compared to the previous decade, 2018 sales were 9.56% above the 10-year average of 8.6 billion gallons of odorized propane sold per year.
In its second sales report for PERC since taking over duties from the American Petroleum Institute, ICF International comments that during 2018 the U.S. experienced warmer-than-normal average weather conditions throughout the year. However, winter temperatures were 11.6% colder than a year earlier, which supported a sharp year-on-year boost for heating load across most of the nation. In the extreme, significant portions of the West suffered record drought and two major hurricanes made landfall in the Carolinas and the Florida Panhandle.
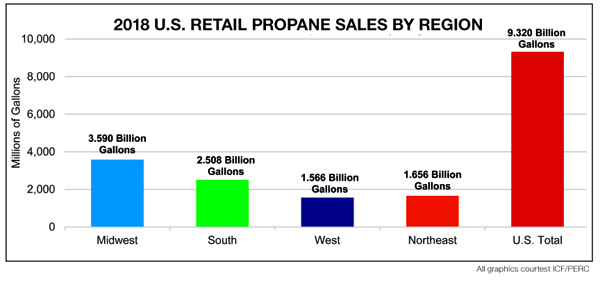
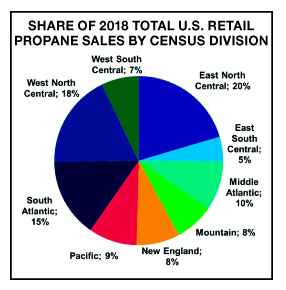
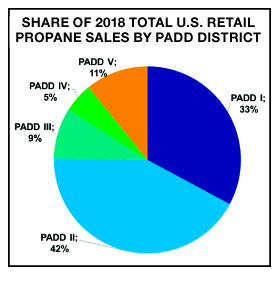
Regional highlights in the report include the Midwest accounting for 38.5% of total U.S. propane sales to register a small relative increase from the 37.6% share in 2017. In 2018, the region was 15% colder compared to the prior year and about 5% colder than the 20-year average from 1999 to 2018. Meanwhile, residential sales climbed from 59% of the Midwest’s total sales in 2017 to 63% and lifted residential volumes to 2.271 billion gallons. In-region sales increases were driven by colder-than-normal winter weather, given the high space heating loads and relatively unchanged number of residential households using propane over the past five years. Midwest agriculture propane sales ended at 548 million gallons and represented 18% of total regional sales.
The South accounted for 26.9% of total U.S. propane sales. Following one of the warmest winters in 2017, a large yearly rise in propane demand was supported by colder-than-normal weather conditions and increased demand from the agricultural sector in 2018. Texas was 46% colder in 2018 than in 2017, with heating degree days climbing from 1346 to 1961 year over year. Other southern states were between 13% and 34% colder than the previous year.
The residential sector represented 46% of total sales, increasing from 959 million gallons in 2017 to 1.155 billion gallons a year later. But propane continued to lose market share to electricity for household space heating in the South, although there has been a slowdown for that trend. In 2018, the region averaged 256 gallons sold per residential account, a 24% increase from the prior year’s average of 207 gallons.
The West accounted for 16.8% of total U.S. propane sales. Following a warmer-than-normal winter in 2017, winter temperatures in the Rocky Mountain and southwestern regions turned 9% colder in 2018. The region averaged 432 gallons sold per residential account, an 8% increase over the previous year’s 401 gallons. Residential sales were 47% of total sales and rose from 699 million gallons in 2017 to 736 million gallons in 2019. Agricultural, commercial, and industrial sales climbed, increasing 12% to 648 million gallons, while internal combustion sales declined to 87 million gallons.
The Northeast accounted for 17.8% of total U.S. propane sales and enjoyed a 13.9% increase in year-over-year sales to 1.656 billion gallons in 2018. The region was 2% colder than the 20-year average, supporting higher sales per account and total heating demand. The Northeast continued to experience a net increase in propane-heated households, which rose 26% from 2012 to 2018, including a 2.7% improvement in 2018.
Residential sales represented 62% of the total, with commercial volumes accounting for 27%. The region had the highest share of residential and commercial sales, accounting for 89% of regional sales in 2018, or 1.470 billion gallons. In 2018, average residential sales per account climbed 18% year on year to average 397 gallons per account.
Rankings
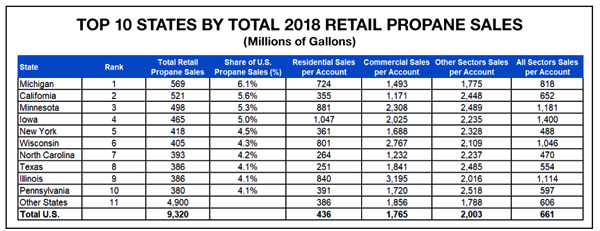
The top 10 states, ranked by total retail sales in 2018, accounted for 47.4% of U.S. propane sales, while the remaining 40 states and the District of Columbia represented 52.6% of total sales. Michigan passed California to become the top state by total sales in 2018 after placing second in 2017. Michigan was also the top-ranked state in residential sales, banking 453 million gallons in 2018. Second-place California was nonetheless the number one state in the commercial market with 136 million gallons sold; the cylinder market leader with for 45 million gallons sold; and was the first-place winner in the internal combustion segment with 46 million gallons in sales.
Minnesota held on to third place in total retail sales in 2018. The state was also ranked second in both the residential and agriculture sectors, whose respective sales volumes totaled 299 million gallons and 111 million gallons. Iowa moved from fifth to fourth in total sales, growing its gallons sold to 465 million. The state remained the top-ranked state for agriculture sales and ranked fifth in the residential sector. New York was the fifth ranked state by total sales in 2018 and placed third in the residential sector and fourth in the commercial sector. Residential sales totaled 283 million gallons and commercial 89 million gallons.
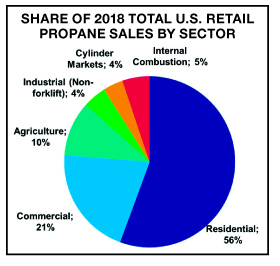
ICF International reports there were nearly 12 million residential accounts across the U.S. in 2018, a slight decline from 2017 levels. These residential accounts included 5.7 million households that used propane for primary space heating. The residential sector accounted for 55.6% of total sales, or 5.184 billion gallons. The sector had average sales of 436 gallons per account. The commercial sector represented 20.6% of total sales, or 1.924 billion gallons, with average sales of 1765 gallons per account. The agriculture sector made up 10.4% of total sales, or 966 million gallons, with average sales of 1914 gallons per account.
The industrial (non-forklift) sector comprised 4.4% of total sales, or 412 million gallons There was an average of 2230 gallons per account. The cylinder markets sector constituted 3.8% of sales, or 354 million gallons, with average sales of 1305 gallons per account. The internal combustion sector held 5.1% of sales, or 479 million gallons, with average sales of 3349 gallons per account.
10-Year Trend
ICF International outlines that over the past 10 years sales in the retail propane sector have risen modestly, fluctuating with changes in weather, relative fuel pricing, and general economic conditions. From 2008 to 2018, odorized propane volumes averaged 8.6 billion gallons a year. At the same time, residential propane sales declined, the result of both fewer total households using propane for space heating and continued improvements in energy efficiency.
But in 2018, residential propane sales per household increased by 17% to average 896 gallons. This reversed several years of lower-than-average residential sales due to warmer-than-normal weather. The rise of propane sales in 2018 was partly due to temperatures being colder than the 10-year-average year.
Additionally charted was that from 2009 to 2018, U.S. propane production underwent an unprecedented expansion, rising from 16.8 billion gallons to more than 30 billion gallons, which included minor volumes of propylene. This advance was nearly entirely due to growth in natural gas and liquids output, with propane production from gas processing plants increasing by 13.3% from 2017 to 2018 to reach 21.4 billion gallons, more than double 2018 U.S. retail propane sales.
As a result, the U.S. propane industry has undergone a dramatic transformation, with the focus dramatically shifting from domestic markets to an overriding emphasis on growing exports. U.S. propane/propylene exports rose from 0.8 billion gallons in 2008 to 14.5 billion gallons in 2018. Exports now represent more than 50% of U.S. production and are significantly larger than odorized propane sales. Simultaneously, in recent years there have been several new propane dehydrogenation, or PDH, facilities built in the U.S. to take advantage of growing domestic propane supply. These plants use propane to produce propylene, a primary product used to manufacture plastics.
The annual Retail Propane Sales Report is used to determine odorized sales to end-use sectors. It is the only source of state-level, end-use sector sales information. This data is required by PERC to fulfill requirements of the 1996 Propane Education and Research Act (PERA), legislation that created the council and charter its operations. Under the act, 20% of assessment collections are eligible for rebate back to states. Rebate allocations are determined by the percentage of odorized propane sales in each.
PERA also places limits on the share of total PERC investment in the on-road market to no more than the share of the total propane market used for motor vehicle combustion, and sets a minimum of 5% of total assessments that must be allocated to the agricultural sector each year.
The allocation of odorized propane sales between the states has a marked impact on PERC’s spending apportionments. Each state’s rebate amount is based on the latest retail sales data for residential, commercial, industrial, internal combustion engine fuel, agricultural uses, and sales to retail dispensers that are calculated using responses to the report survey. As a result, the confidential reporting of proprietary sales volumes by propane retailers is a critical component of PERC’s budgeting process, and to meet its PERA obligations. — John Needham

In its second sales report for PERC since taking over duties from the American Petroleum Institute, ICF International comments that during 2018 the U.S. experienced warmer-than-normal average weather conditions throughout the year. However, winter temperatures were 11.6% colder than a year earlier, which supported a sharp year-on-year boost for heating load across most of the nation. In the extreme, significant portions of the West suffered record drought and two major hurricanes made landfall in the Carolinas and the Florida Panhandle.
Regional highlights in the report include the Midwest accounting for 38.5% of total U.S. propane sales to register a small relative increase from the 37.6% share in 2017. In 2018, the region was 15% colder compared to the prior year and about 5% colder than the 20-year average from 1999 to 2018. Meanwhile, residential sales climbed from 59% of the Midwest’s total sales in 2017 to 63% and lifted residential volumes to 2.271 billion gallons. In-region sales increases were driven by colder-than-normal winter weather, given the high space heating loads and relatively unchanged number of residential households using propane over the past five years. Midwest agriculture propane sales ended at 548 million gallons and represented 18% of total regional sales.

The South accounted for 26.9% of total U.S. propane sales. Following one of the warmest winters in 2017, a large yearly rise in propane demand was supported by colder-than-normal weather conditions and increased demand from the agricultural sector in 2018. Texas was 46% colder in 2018 than in 2017, with heating degree days climbing from 1346 to 1961 year over year. Other southern states were between 13% and 34% colder than the previous year.
The residential sector represented 46% of total sales, increasing from 959 million gallons in 2017 to 1.155 billion gallons a year later. But propane continued to lose market share to electricity for household space heating in the South, although there has been a slowdown for that trend. In 2018, the region averaged 256 gallons sold per residential account, a 24% increase from the prior year’s average of 207 gallons.

The West accounted for 16.8% of total U.S. propane sales. Following a warmer-than-normal winter in 2017, winter temperatures in the Rocky Mountain and southwestern regions turned 9% colder in 2018. The region averaged 432 gallons sold per residential account, an 8% increase over the previous year’s 401 gallons. Residential sales were 47% of total sales and rose from 699 million gallons in 2017 to 736 million gallons in 2019. Agricultural, commercial, and industrial sales climbed, increasing 12% to 648 million gallons, while internal combustion sales declined to 87 million gallons.
The Northeast accounted for 17.8% of total U.S. propane sales and enjoyed a 13.9% increase in year-over-year sales to 1.656 billion gallons in 2018. The region was 2% colder than the 20-year average, supporting higher sales per account and total heating demand. The Northeast continued to experience a net increase in propane-heated households, which rose 26% from 2012 to 2018, including a 2.7% improvement in 2018.
Residential sales represented 62% of the total, with commercial volumes accounting for 27%. The region had the highest share of residential and commercial sales, accounting for 89% of regional sales in 2018, or 1.470 billion gallons. In 2018, average residential sales per account climbed 18% year on year to average 397 gallons per account.

Rankings
The top 10 states, ranked by total retail sales in 2018, accounted for 47.4% of U.S. propane sales, while the remaining 40 states and the District of Columbia represented 52.6% of total sales. Michigan passed California to become the top state by total sales in 2018 after placing second in 2017. Michigan was also the top-ranked state in residential sales, banking 453 million gallons in 2018. Second-place California was nonetheless the number one state in the commercial market with 136 million gallons sold; the cylinder market leader with for 45 million gallons sold; and was the first-place winner in the internal combustion segment with 46 million gallons in sales.
Minnesota held on to third place in total retail sales in 2018. The state was also ranked second in both the residential and agriculture sectors, whose respective sales volumes totaled 299 million gallons and 111 million gallons. Iowa moved from fifth to fourth in total sales, growing its gallons sold to 465 million. The state remained the top-ranked state for agriculture sales and ranked fifth in the residential sector. New York was the fifth ranked state by total sales in 2018 and placed third in the residential sector and fourth in the commercial sector. Residential sales totaled 283 million gallons and commercial 89 million gallons.
ICF International reports there were nearly 12 million residential accounts across the U.S. in 2018, a slight decline from 2017 levels. These residential accounts included 5.7 million households that used propane for primary space heating. The residential sector accounted for 55.6% of total sales, or 5.184 billion gallons. The sector had average sales of 436 gallons per account. The commercial sector represented 20.6% of total sales, or 1.924 billion gallons, with average sales of 1765 gallons per account. The agriculture sector made up 10.4% of total sales, or 966 million gallons, with average sales of 1914 gallons per account.
The industrial (non-forklift) sector comprised 4.4% of total sales, or 412 million gallons There was an average of 2230 gallons per account. The cylinder markets sector constituted 3.8% of sales, or 354 million gallons, with average sales of 1305 gallons per account. The internal combustion sector held 5.1% of sales, or 479 million gallons, with average sales of 3349 gallons per account.

10-Year Trend
ICF International outlines that over the past 10 years sales in the retail propane sector have risen modestly, fluctuating with changes in weather, relative fuel pricing, and general economic conditions. From 2008 to 2018, odorized propane volumes averaged 8.6 billion gallons a year. At the same time, residential propane sales declined, the result of both fewer total households using propane for space heating and continued improvements in energy efficiency.
But in 2018, residential propane sales per household increased by 17% to average 896 gallons. This reversed several years of lower-than-average residential sales due to warmer-than-normal weather. The rise of propane sales in 2018 was partly due to temperatures being colder than the 10-year-average year.
Additionally charted was that from 2009 to 2018, U.S. propane production underwent an unprecedented expansion, rising from 16.8 billion gallons to more than 30 billion gallons, which included minor volumes of propylene. This advance was nearly entirely due to growth in natural gas and liquids output, with propane production from gas processing plants increasing by 13.3% from 2017 to 2018 to reach 21.4 billion gallons, more than double 2018 U.S. retail propane sales.
As a result, the U.S. propane industry has undergone a dramatic transformation, with the focus dramatically shifting from domestic markets to an overriding emphasis on growing exports. U.S. propane/propylene exports rose from 0.8 billion gallons in 2008 to 14.5 billion gallons in 2018. Exports now represent more than 50% of U.S. production and are significantly larger than odorized propane sales. Simultaneously, in recent years there have been several new propane dehydrogenation, or PDH, facilities built in the U.S. to take advantage of growing domestic propane supply. These plants use propane to produce propylene, a primary product used to manufacture plastics.
The annual Retail Propane Sales Report is used to determine odorized sales to end-use sectors. It is the only source of state-level, end-use sector sales information. This data is required by PERC to fulfill requirements of the 1996 Propane Education and Research Act (PERA), legislation that created the council and charter its operations. Under the act, 20% of assessment collections are eligible for rebate back to states. Rebate allocations are determined by the percentage of odorized propane sales in each.
PERA also places limits on the share of total PERC investment in the on-road market to no more than the share of the total propane market used for motor vehicle combustion, and sets a minimum of 5% of total assessments that must be allocated to the agricultural sector each year.
The allocation of odorized propane sales between the states has a marked impact on PERC’s spending apportionments. Each state’s rebate amount is based on the latest retail sales data for residential, commercial, industrial, internal combustion engine fuel, agricultural uses, and sales to retail dispensers that are calculated using responses to the report survey. As a result, the confidential reporting of proprietary sales volumes by propane retailers is a critical component of PERC’s budgeting process, and to meet its PERA obligations. — John Needham

