

 Editor’s Note: This article includes excerpts from a recent blog post published on RBN Energy’s website, rbnenergy.com. BPN has permission to print the data and commentary included in this article.
In a March 8, 2022, blog post titled “Comfortably Numb — A Reality Check on Energy Prices and Their Impacts,” Rusty Braziel, CEO and president of RBN Energy, and his team challenged the “record-breaking” hype. The following are major excerpts:
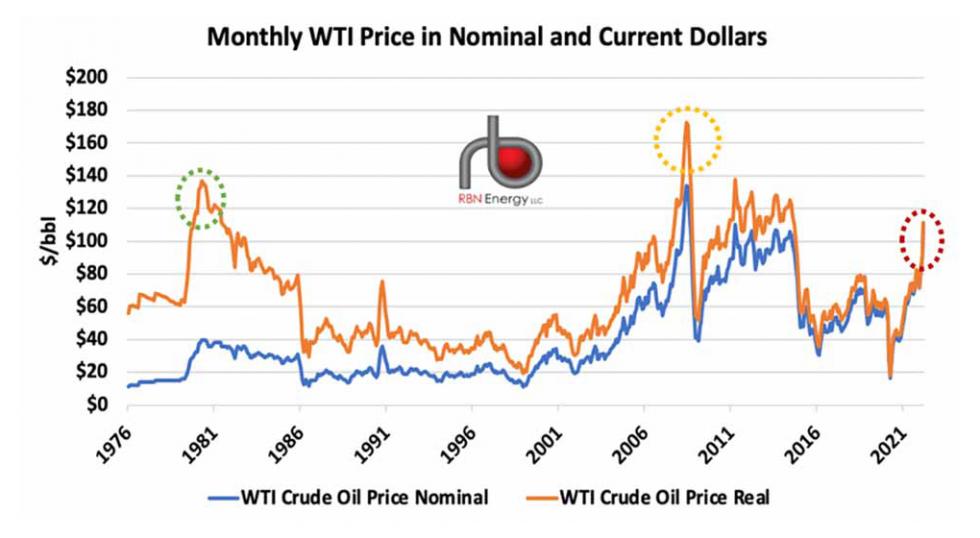
“The numbers don’t lie. First, we’ll look at WTI crude oil prices. Figure 1 shows both nominal prices for WTI (the monthly average prices as they were recorded at the time; blue line) and prices in current, inflation-adjusted 2022 dollars (orange line). (As you would expect, the gap between nominal and current-dollar prices narrows over time.) While the WTI price rise has been nearly parabolic in recent weeks and averaged about $111/bbl the first week of March (dashed red oval), in real dollars, the current price of WTI is still lower than 40-plus months in the 2007-14 period, when the 2000s commodity boom caused crude prices to soar. The boom culminated in June 2008 after a sharp run-up, peaking at [around] $173 (dashed gold circle) in current dollars, when the nominal price of WTI was [around] $134. That runup was then punctuated by the sub-prime mortgage crisis and onset of the Great Recession. WTI was also higher in real-dollar terms every month between November 1979 and May 1981 (dashed green oval), when the current-dollar price of WTI peaked at about $137/bbl and the nominal price ranged from $31 to just shy of $40/bbl. That period, known as the 1979 Oil Shock, was caused by a series of unfortunate events in the Middle East.
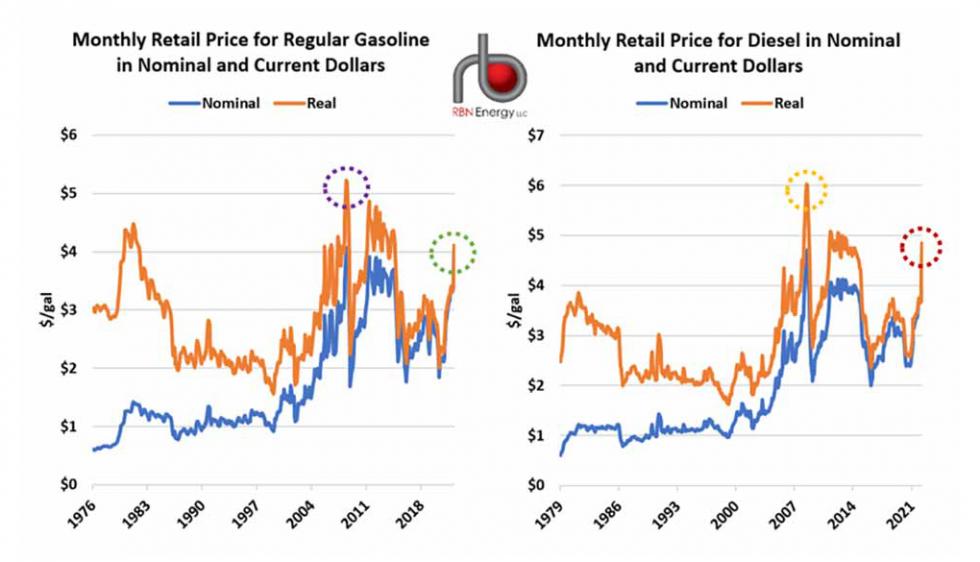 “It should come as no surprise that the price of oil imported to the United States followed the same pattern, with an all-time peak (in real dollars) in 2008 and higher-than-today prices in 1979-81 and 2007-14. The same holds true for gasoline prices — see the left graph in Figure 2. The average price for regular gasoline in the week ended March 7 was $4.10/gal (dashed green oval), the highest level (again, in current, inflation-adjusted dollars) since August 2014, though — much as with WTI — gasoline prices were higher than they are today for more than 40 months in the 2006-14 period, peaking at $5.22/gal in June 2008 (dashed purple oval). The nominal price for regular gasoline at that peak was $4.05/gal.
“The diesel story is slightly different, and a little more ominous for truckers and others who depend on that fuel. The average diesel price for the week ended March 7 was $4.85/gal (dashed red circle), a mark topped (in current dollars) in only 18 months in the 2008-2013 period — the highest real-dollar price for diesel ($6.02/gal) happened in both June and July of 2008 (dashed gold circle).
“Once more, our aim here isn’t to discount the significance of — or the financial pain associated with — the high crude oil and motor fuel prices that U.S. businesses and individuals are dealing with today. Instead, our goal (as always) is to put things in perspective, and to note that crude oil, gasoline and diesel prices have been considerably higher in the past. We haven’t heard that from media of any stripe.
 “There are a couple of other things to consider as well when discussing today’s motor fuel prices. For example, major commodity price booms tend to be associated with significant geopolitical events; the hope is that when they end, prices revert to lower levels. Another one is this: Back in 1973-74, during the first OPEC oil embargo, the fuel efficiency for light-duty vehicles (cars and pickups) averaged 13.5 miles per gallon (MPG). By 1980, thanks to a gas-price-driven shift to more economical vehicles (including the horrible Chevy Chevette and AMC Eagle), the average vehicle efficiency had risen to 16 MPG. But that was only the beginning. Thanks to a combination of the federal government’s Corporate Average Fuel Economy (CAFE) standards and technological advances, the average efficiency for light-duty vehicles is now more than 25 MPG. (A new Biden Administration rule has established a 40-MPG goal for 2026.)
“So, in effect, the $4.10/gal the average American paid at the pump last week to fuel an average 25-MPG vehicle could travel 250 miles on 10 gallons (total cost $41), for an average cost of just over 16 cents/mile. Back in 1980, when gasoline cost $4.24/gal in real dollars (and $1.25/gal in 1980 dollars) and the average vehicle got only 16 MPG, that same guy or gal would need to use about 15.6 gallons (at a real-dollar cost of $66.25) to travel those same 250 miles. What, then, would be their average cost per mile in 2022 dollars? About 26.5 cents/mile, or more than 60% higher than the 16-cents/mile cost today.
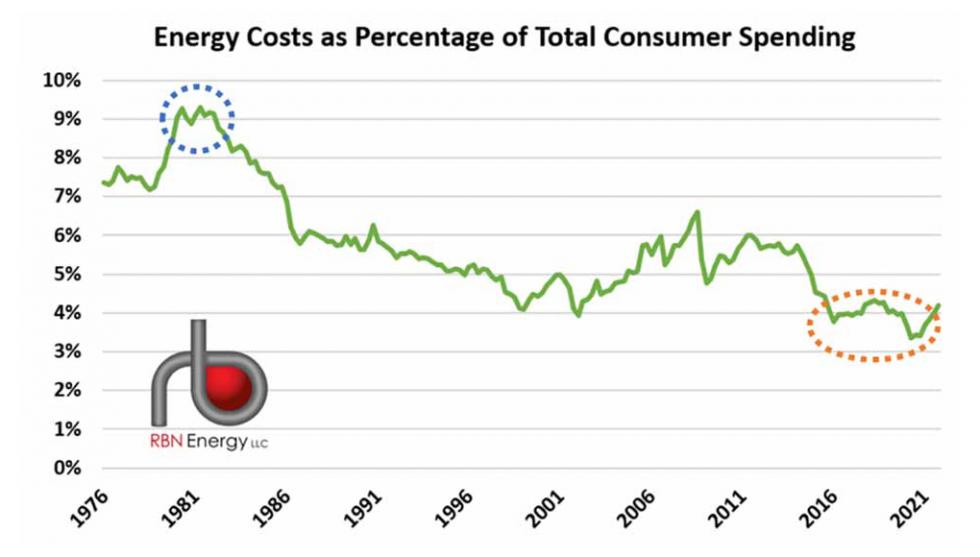
“One further thing to factor in: energy’s declining share of total U.S. consumer spending, with energy in this case meaning the sum of motor fuels, natural gas and electricity costs. According to the U.S. Bureau of Economic Analysis (BEA), American spending on energy has been trending down over the past several decades, from more than 9% of total spending in the early 1980s (dashed blue oval [Figure 3]) to around 4% since the mid-2010s (dashed orange oval). Surely that percentage will rise in the first quarter of 2022, and maybe in the second quarter too. Still, we would be surprised if it topped 5% and — given all the seemingly nonstop media chatter about so-called record-breaking oil, gasoline and diesel prices — that is not so bad by historical standards.”
Crude oil prices before the war in Ukraine were less than $100 and were expected to fall over the next couple of years with the plan for increased production; now there are many more unknowns. Is crude oil pricing in the three digits here to stay, and how high could prices get? Will higher prices spur more production or will demand destruction take place? If history is any indication, Braziel suggests $135-$150/bbl would be a good guess based on where demand destruction started hurting the U.S. economy back in 1980-81 and again in 2007.